You’ve used a computer to generate a schedule, but have you ever wondered what the termsEarly Start, Late Finish, Total Float,orCritical Pathreally mean? This article will guide you through the basics of schedule calculations. With simple example schedule we will understand how start\finish dates and float values for activities are calculated.
Introduction
Schedules are used as management tools to communicate work sequence, communicate start/finish dates for activities, and to track progress on just about every type of project. In today’s business world of complex projects, managers can get lost in the plethora of information provided by the project schedule.
While important terms such as theEarly Start Dates, Late Finish Dates, Total Float,orCritical Pathcommonly appear on computer generated schedules, project managers might not fully understand what they really mean! As a result, decisions made by management based on this lack of knowledge may not be as effective as they could have been.
Managers working on any kind of project must be conversant with the basic scheduling terms. And to fully understand these terms, one must learn how their values are calculated. This article will discuss the basic terminology of scheduling using Activity-On-Node (AON) calculation methods.
Terms and Abbreviations
Critical Path Method (CPM) schedules have evolved into valuable management and communication tools for today’s complex projects. Activity-on-Node (AON) schedules show theCritical Pathof the schedule, and thus are considered to be CPM Schedules. It is through these schedules that the logical flow of the work sequence is graphically illustrated.
In addition, schedules also show the planned start/finish dates for activities, schedule duration, and float values for the individual activities on the project. There are many software packages available in the market that calculate the Critical Path of the schedule and show it graphically in network diagram. However, I strongly believe that project managers must become knowledgeable in the schedule calculation process in order to fully understand the importance of schedules.
By doing so, project managers will recognize how activity-sequencing affects planned start/finish dates for activities and the duration of the schedule. Also, after understanding float values and their definitions, managers will be able to apply this knowledge in their schedule analysis should a delay occur on the project.
A schedule graphically displays the flow of the work sequence and assigns start/finish dates for activities once they are calculated. Before we start calculating the float values and critical path in the schedule, understanding of Terms and abbreviations used in basic scheduling terminology is essential. Here is a list of basic scheduling terms:
- Activity-On-Node diagram: An Activity-on-Node (AON) diagram is a type of logic diagram used in project scheduling to represent the sequence of activities. Each activity is depicted as a node (usually a square or rectangle), and the relationships between these activities are shown with arrows.
- Critical Activity: Any activity in the schedule that does not possess any float; Total Float=0. This means that any delay in a critical activity will directly delay the entire project.
- Critical Path: The continuous string(s) of critical activities in the schedule between the Start and Finish of the project. The sum of the activity durations in the Critical Path is equal to the Project’s Duration; therefore, a delay to any Critical Activity will result in a delay to the Project Completion Date. It also represents the shortest time in which the project can be completed.
- Critical Path Method (CPM): Any calculation method that shows theCritical Pathin the schedule
- Duration: The amount of time required to complete a schedule activity
- Early Start (ES): Earliest date the activity can start without any delays from preceding activities
- Early Finish (EF): Earliest date that the activity can finish if it starts at its Early Start (ES) date and proceeds without any delay.
- Free Float (FF): The maximum number of days the activity can be delayed without delaying any succeeding activity. It is a measure of scheduling flexibility
- Lag: Planned wait time between activities
- Late Finish (LF): Latest date that the activity can finish without causing a delay to the project completion date.
- Late Start (LS): Latest date that the activity can start without causing a delay to the project completion date.
- Predecessor: A predecessor activity in schedule is an activity that must be completed before another activity can begin.
- Successor: A successor activity in schedule is a dependent activity that logically follows another activity in a schedule.
- Total Float (TF): The maximum number of days the activity can be delayed without delaying the project completion date.
A project schedule is an operating time table of a project. It serves as a basis for monitoring and controlling project activity.. Interested in learning more on schedule development process. Check out this article.
Activity On Node diagram
Each project, whether it is a simple assignment or a large complicated job, can be broken down into a list of individual work activities that need to be completed in a specific sequence. This sequence of activities, which is usually pre-planned by project team prior to project commencement, will dictate the logical order in which activities start or finish.
A common way to express the sequence, or logical order, of the activities is through the means of a logic diagram. In a logic diagram, “nodes” (squares or rectangles) represent each activity with arrows representing the relationships between these activities. Hence, the names of logic diagrams are commonly referred as “Activity-on-Node” (AON) diagrams.
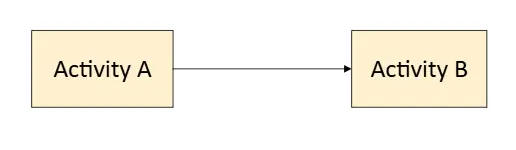
A common relationship between activities in schedule is shown by Finish to Start relationship. In this type of relationship, the preceding activity (Activity A) must be 100% complete (or finished) before succeeding activity (Activity B) can start. The relationship is shown by arrow exiting the finish side of Activity A and entering the start side of Activity B. Therefor this is known as Finish To Start relationship and is represented in Activity On Node diagram as follows:
Activity Node Format
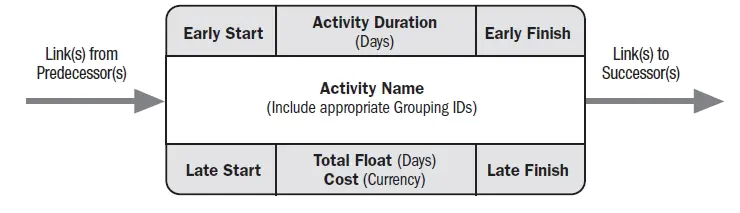
The activity node format is a standardized way of representing activities within a project network diagram, specifically in the Activity on Node (AoN) method. This format helps in organizing and displaying essential information about each activity, facilitating the calculation of project schedules and the identification of critical paths.
As per Practice Standards of Project Scheduling, released by PMI, the activity is represented as a box containing key information. The box is represented as below:
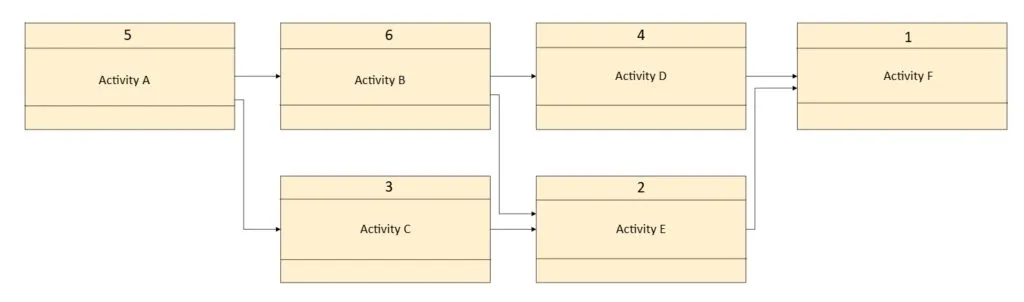
An example of network diagram is shown. Generic activities are used in the example to help explain the different calculation processes. Activity durations are in Days.
Forward Pass
The first step in the calculation process is known as the Forward Pass. In the forward pass, the Early Start and Early Finish values for each activity, along with the overall Project Duration, are calculated.
To facilitate schedule calculations, an “end of day” notation is used for both the Early Start and the Late Start values. By doing this, the start of the network diagram is the “end of Day Zero”. In other words, the calculation process begins with placing a zero in the Early Start (ES) position of the first activity. The rest of the calculation continues with the use of the following formulas:
- Early Start (ES) = Maximum (or Highest) Early Finish (EF) value from immediate Predecessor(s)
- Early Finish (EF) = Early Start (ES) + Duration
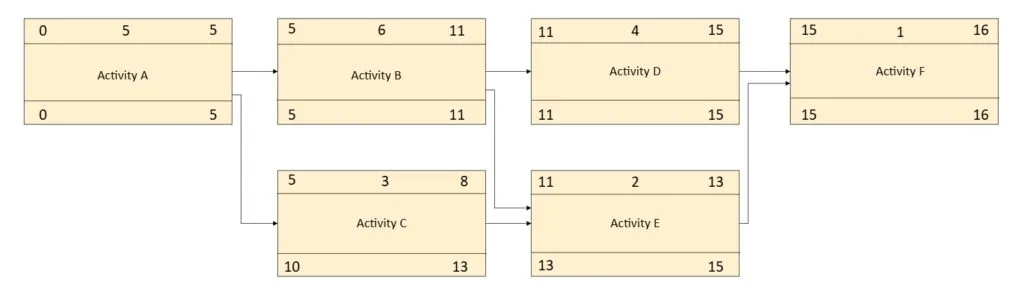
An example of a Forward Pass calculation is shown below:
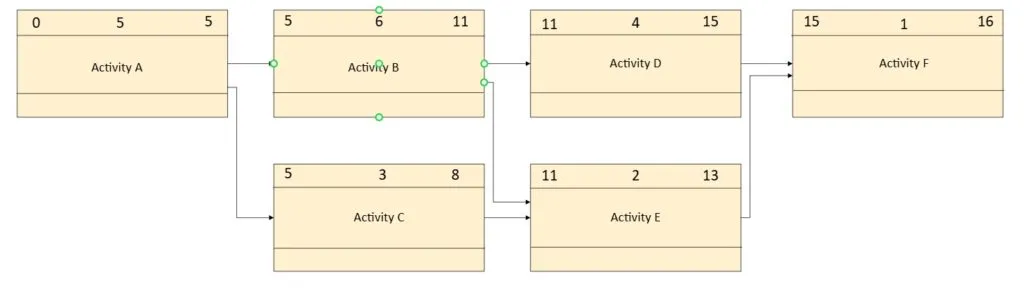
Note that ES of Activity E is based on maximum early finish from its two predecessors (Activity B and Activity C). Based on the Finish-to-Start relationship shown, both Activity B and Activity C must both be finished before Activity E can start. In other words, Activity E is waiting on whichever predecessor finishes the latest (in this case, Activity B). The same situation exists for Activity F. The duration of schedule is shown in the EF of last activity in a network. EF value of Activity F is 16, hence the schedule duration is 16 days.
Backward Pass
The second step in the calculation is comprised of the Backward Pass. Through this pass, the Late Start and Late Finish values are calculated. The formulas for the backward pass are shown below:
- Late Start (LS) = Late Finish (LF) – Duration
- Late Finish (LF) = Minimum (or Lowest) Late Start (LS) value from immediate Successor(s)
As the name implies, this calculation step starts at the last activity in the schedule and proceeds backward through the schedule until the Late Start value is computed for the schedule’s beginning activity. An example of Backward Pass calculation is shown below:
To start the backward pass calculation, the EF value in the last activity is “copied” as the LF value. Now the backward pass formulas for late start and late finish can be applied. Note that in diagram above, the LF value for Activity B is based on the lowest LS shown by its two successors (Activity D and Activity E).
Do you know Microsoft Project is the most widely used scheduling software in the industry. Check out this article on gentle introduction to Microsoft Project tool.
Float Calculations
Float values indicate how much each individual activity can be delayed before affecting successor activities or the planned project completion date. Formulas for calculating Total Float and Free Float are as follows:
- Total Float = Late Start (LS) – Early Start (ES) (it is also calculated by Late Finish – Early Finish)
- Free Float = Lowest Early Start (Es) of successors – Early Finish (EF)
Total Float values are shown below:
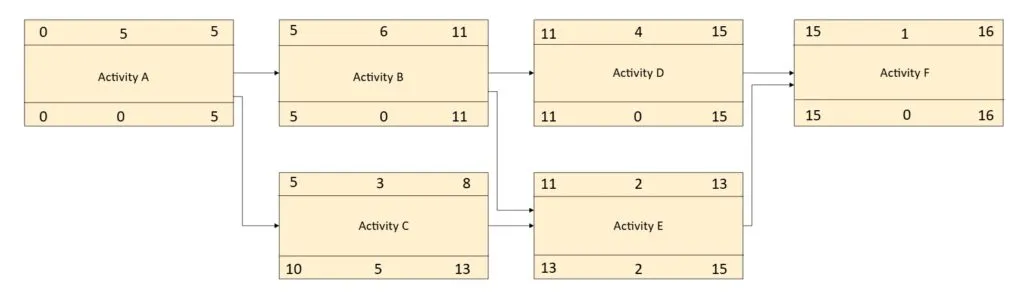
Total Float shows the difference between theearliestdate that the activity can start andlatestdate the activity can start before the completion date is delayed. Total float can also be calculated as the difference between Late Finish and Early Finish, asLS minus ESandLF minus EFcalculate the exact same number.
Free Float, per definition, is the amount of time that the activity can be delayed before any successors will be delayed. Early Start/Finish times are used to calculate the Free Float values. So in basic terms, the finish date (Early Finish) of the activity is compared with the planned start (Early Start) of succeeding activities. As shown in figure, Activity C has three days of float before the start of Activity E will be delayed.
Critical Path
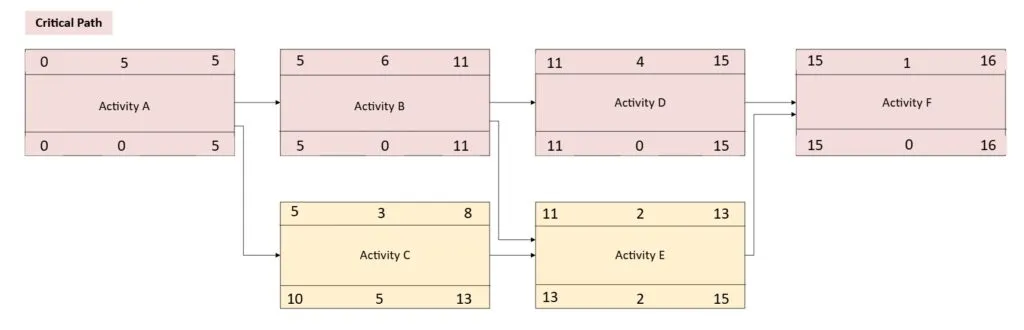
Once the float values are calculated, the string of critical activities will be identified. This continuous string of critical activities is called the Critical Path. Critical activities are those that do not posses any float.
In the network diagram, Path A-B-D-F has zero Total Float, hence is on critical path.
Note that the summation of the critical activity durations (Path A-B-D-F) is equal to the overall project duration (which was calculated in the forward pass). This reinforces the fact that a delay (or additional time added to the activity duration) in any critical activity will cause a subsequent delay in the completion date.
Calculation Rules
You can conduct following checks to ensure your calculations for critical path are correct:
- An activity’s value for Total Float can either be greater or equal to Free Float. In other words, Free Float canneverbe larger than its value for Total Float.
- The Critical Path must becontinuousfrom the first activity in the schedule all the way through to the last activity.
- Negative numbers should not appear for any calculated value.
Common Misconceptions about Critical Path
In the realm of general management, there are many misconceptions about Critical Path. Let’s cover some basic ones.
Misconception: The critical path is the shortest path through the network diagram.
Fact: The critical path is the longest path through the network diagram, meaning the sequence of activities that collectivly define the starting and ending dates for the project and have no float time (excess time).
Misconception:Every task on the critical path is critical.
Fact: The word “critical” in this context usually has nothing to do how important these tasks are to the overall plan, but instead refers to how their scheduling will affect the project’s finish date. Also, managers have to remember after a task on the critical path is completed, it’s no longer “critical” because it cannot affect the plan’s finish date.
Misconception:The critical path will never change.
Fact: Every project has at least some changes (for example, scope, time, and/or budget) which means the critical path(s) will change. This will result in a new expected completion date for the project. Other reasons why the critical path will change periodically is because some of the tasks will be completed ahead or behind schedule, and/or task relationships can change.
Misconception:If you shorten the length of a task on the critical path, then the project will be completed sooner.
Fact:It depends! If you do this, more than likely the “shortened” task on the critical path could be replaced with a longer, non-critical task that now becomes a critical task. This means you have a new critical path(s) and a new completion date. It’s important to remember that reducing the critical path on most projects to shorten a project’s duration is not a trivial exercise. It requires close scrutiny of entire project schedule, most often studying near critical activities (activities that have consumed more than 80% of total float).
There are schedule compression techniques available to possibly shorten the length of a schedule if done correctly. For example, the scope of the project could be reduced and/or have more people assigned to work on critical tasks helping to compress the schedule.
Summary
Activity node format is essential for organizing and displaying critical information about each activity in a project network diagram. It facilitates the calculation of early and late start and finish dates, as well as the identification of float values, helping project managers to create accurate schedules and manage project timelines effectively.
With an example of simple netwrok diagram, we illustrated the concept of Critical Path method calculations. We used Forward pass, Backward pass calculations and float values to calculate the network critical path. Critical activities are those that do not posses any float.
In the end, we also touched upon the common misconceptions around the concept of critical path.
References
- Practice Standards for Scheduling, Third Edition
- Project Management Body of Knowledge, Seventh edition


