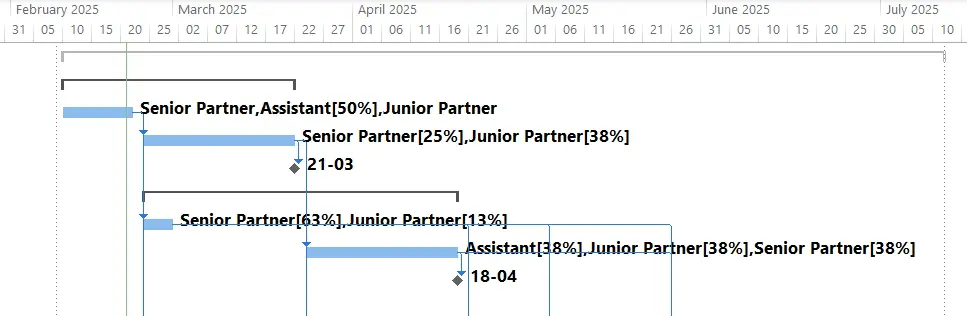
Gantt chart is the default view in MS Project. Gantt Chart pane, which is shown on the right side of Gantt Chart view, displays following information:
- Detailed tasks are displayed with a light blue Gantt bar with the names of the assigned resources shown at the right end of the Gantt bar.
- Milestone tasks are displayed as a black diamond with theFinishdate of the task shown to the right of the milestone symbol.
- Summary tasks are displayed as displayed as a black square bracket, with no text to the right of the summary task symbol.
- Link lines are displayed with a “right angle” arrow from one end of thePredecessortask’s Gantt bar to one end of theSuccessortask’s Gantt bar.
The default formatting of Gantt chart pane looks like as below:
Formatting Gantt Chart Pane
Microsoft Project offers you many ways to apply custom formatting to theGantt Chartpane portion of theGantt Chartview. For example, suppose that we want to format theGantt Chartpane with the following requirements:
- Display summary tasks as a green square bracket with the% Completevalue shown to the right of the summary task symbol.
- Display detailed tasks with a light green color, with the initials of the assigned resources shownabovethe Gantt bar, and the% Completevalue shown to the right of the Gantt bar.
- Display milestone symbols as a red diamond, with theFinishdate shown to theleftof the milestone symbol, and the% Completevalue shown to the right of the milestone symbol.
- Display link lines using a curved arrow rather than the “right angle” arrow.
Interested in learning Microsoft Projects skills. Check out my 18 HOURS LIVE ONLINE training program on Microsoft projects for Absolute Beginners.
Bar Styles in Gantt Chart
To make the above formatting changes, we will need to take advantage of the power of theBar Stylesdialog. The fastest way to access Bar Styles dialog is to double click anywhere in the white part of the Gantt Chart pane. You can also access the Bar Styles dialog from Gantt Chart Formating ribbon. Clicking Format pick list button in the bar styles sections of ribbon will show you the Bar Styles option. Using either method, Microsoft Projects displays default Bar Style dialog shown in the figure.
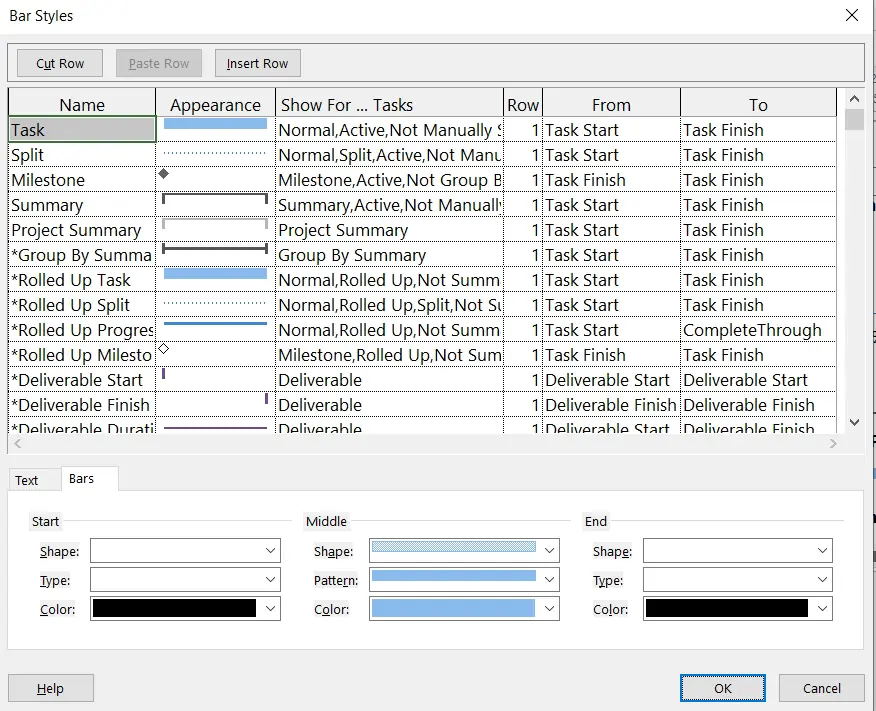
TheBar Stylesdialog displays a data grid that includes every symbol currently available in the applied view. For example, notice that the list includes items such as theTask,Split,Milestone, andSummarysymbols. To the right of each symbol, the data grid includes columns with the instructions for how Microsoft Project will draw the symbol. For example, notice that theTasksymbol is drawn from theTask Startdate to theTask Finishdate, as shown in theFromandTocolumns for theTaskitem in the data grid.
At the bottom of the data grid, theBar Stylesdialog includes two additional formatting sections, and each section is displayed with its own worksheet tab. When you click theBarstab, theBarssection includes the formatting instructions for the start, middle, and end portions of the symbol, including the color used for each portion. When you click theTexttab, theTextsection shows what text to display at the left and right ends of the symbol, as well as on the top, bottom, and inside of the symbol.
Formatting Summary Tasks in Gantt Chart
To format the summary tasks according to our requirements, we will need to complete the following steps:
- Display theBar Styles
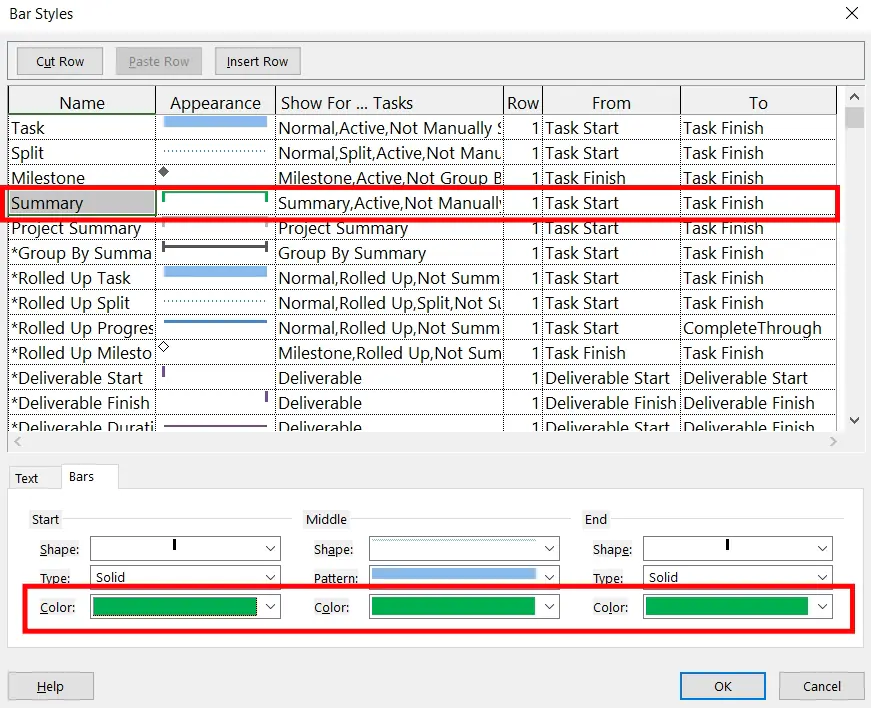
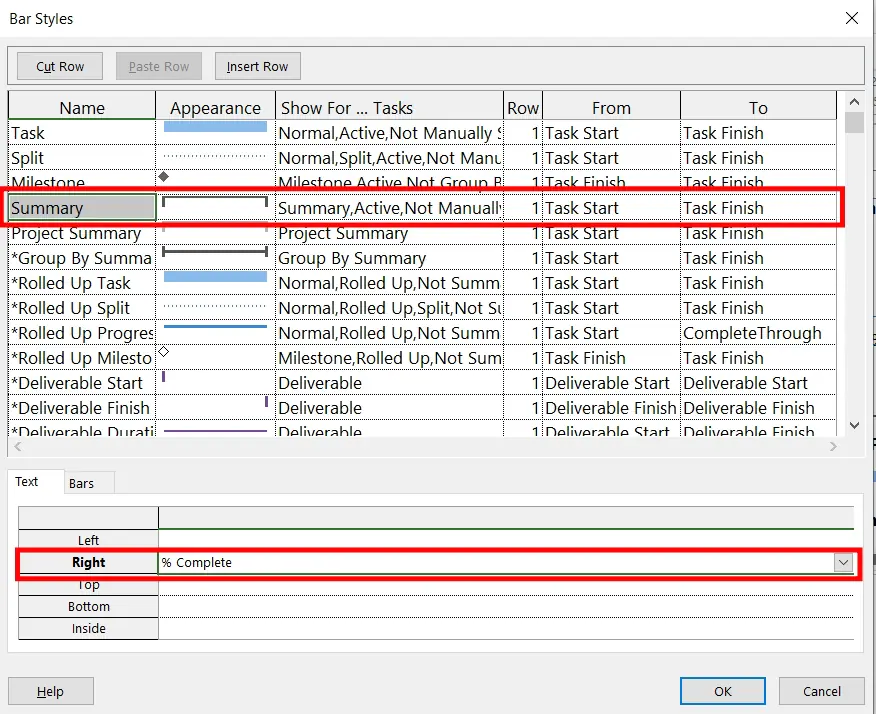
- Select theSummaryitem in the data grid.
- In theBarssection of the dialog, change theColorvalue toGreenfor theStart,Middle, andEndportions of the symbol, such as shown in Figure below
- Click theTextworksheet tab.
- In theTextsection of the dialog, click theRightpick list and select the% Completefield, such as shown in Figure.
Formatting Detailed Tasks
To format the detailed tasks according to our requirements, we will need to complete the following steps:
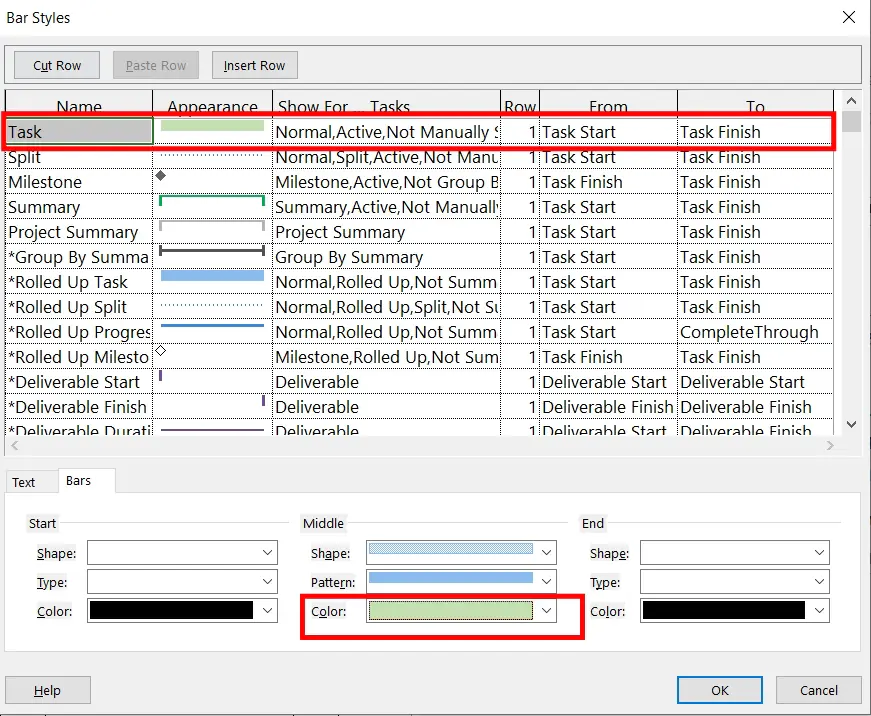
- Select theTaskitem in the data grid.
- In theBarssection of the dialog, change theColorvalue toGreen, Lighter 60%for only theMiddleportion of the symbol, such as shown in Figure
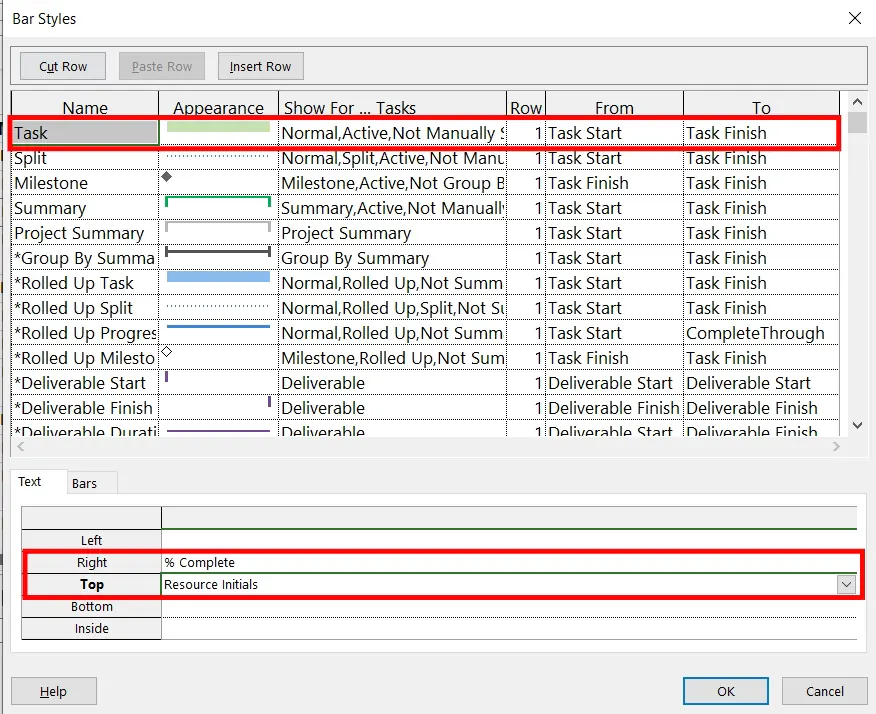
- Click the Text worksheet tab
- In the Text section of the dialog, click the Right pick list and select the % Complete item, then click the Top pick list and select the Resource Initials item, as shown in figure below
Formatting Milestone Tasks
To format the milestone tasks according to our requirements, we will need to complete the following steps:
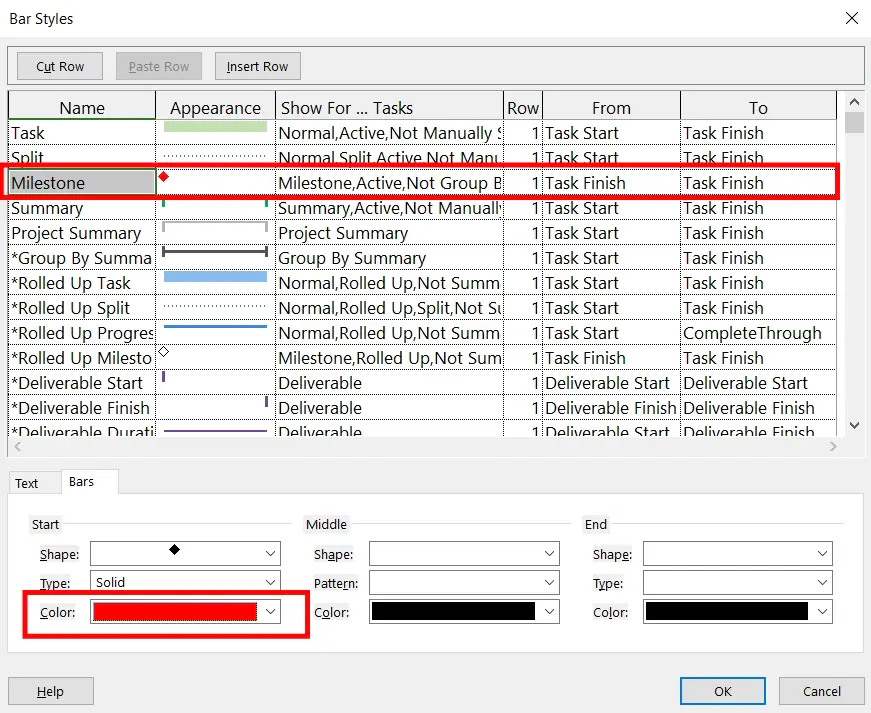
- Select theMilestoneitem in the data grid.
- In theBarssection of the dialog, change theColorvalue toRedfor only theStartportion of the symbol, such as shown in Figure
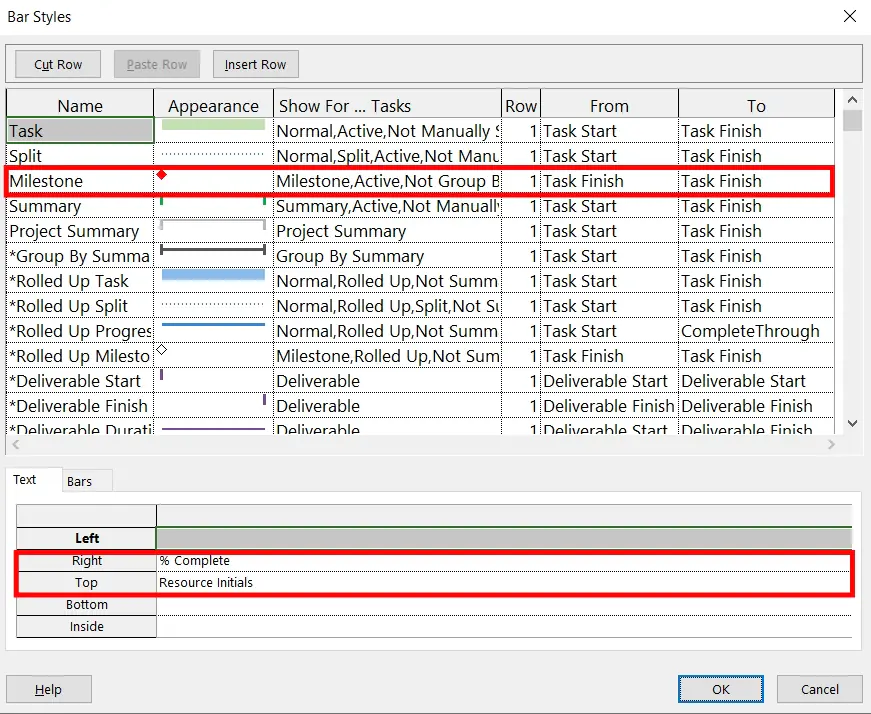
- Click theTextworksheet tab.
- In theTextsection of the dialog, click theLeftpick list and select theFinishitem, then click theRightpick list and select the% Completeitem, such as shown in Figure
Click theOKbutton to close theBar Stylesdialog and apply the new formatting to summary tasks, detailed tasks, and milestone tasks.
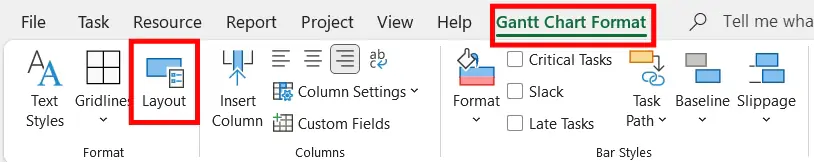
Formatting Link Lines in Gantt Chart
After applying the custom formatting to summary tasks, detailed tasks, and milestone tasks, we are ready to format the link lines by completing the following steps:
- Click theFormattab to display theFormat
- In theFormatsection of theFormatribbon, click theLayoutMicrosoft Project displays theLayoutdialog shown in Figure shown below
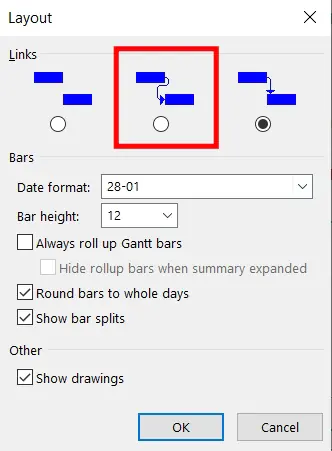
- In theLayoutdialog, select the second item in theLinkssection, as indicated in Figure shown previously.
- Click theOKbutton when finished.
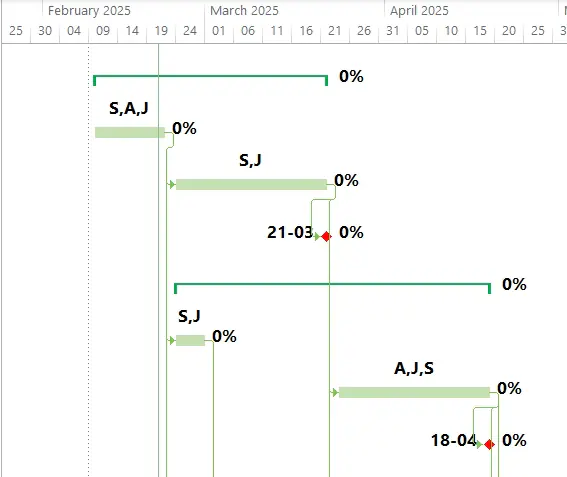
The following figure shows the modified Gantt Chart with all the chnages that we have done so far.
Summary
A Gantt chart is a visual tool that helps in scheduling and decision-making processes by depicting tasks, milestones, and their corresponding start and end dates. We can modify the Gantt Charts in Microsoft Projects to make them more appealing and informative for the target audience. By carefully modifying the Gantt Chart views, we can grab attention of the stakeholders on important tasks that need more discussion and corrective actions.
Further Resources
Interested in learning Microsoft Projects. Check out my 18 HOURS LIVE ONLINE course in Microsoft Projects for Absolute Beginners.


