Gantt charts have long been the go-to tool for project managers, but what if there’s a better way to visualize your project timeline?
While Gantt charts excel at showing task dependencies and deadlines, they often fall short when it comes to flexibility, creativity, and capturing the bigger picture.
Tired of the same old Gantt charts? Discover many different ways to visualize your project timeline
Microsoft Project offers a variety of views to help project managers plan, track, and manage their projects effectively. Each view provides a different perspective on the project data, allowing for comprehensive analysis and decision-making.
Network Diagram
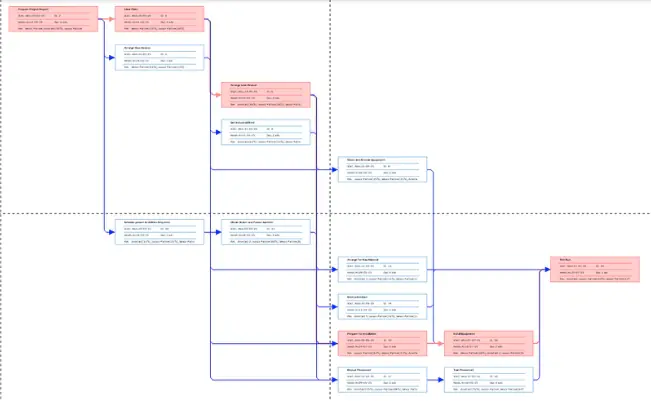
A network diagram in Microsoft Project is a visual representation of the project’s tasks and the dependencies between them.
It helps project managers understand the sequence of activities and the relationships among them, which is crucial for effective project planning and scheduling.
Some of the benefits of using Network Diagram are:
- Graphical Representation: The network diagram displays tasks as boxes (nodes) and dependencies as lines connecting these boxes.
- Logical Relationships: It shows the logical relationships (dependencies) between tasks, such as finish-to-start, start-to-start, finish-to-finish, and start-to-finish.
- Critical Path: The diagram helps identify the critical path, which is essential for understanding which tasks directly impact the project completion date. Critical Path activities are highlighted in Red color.
- Path Convergence and Divergence: Tasks with multiple predecessors (path convergence) and multiple successors (path divergence) are highlighted, indicating higher risk areas.
Tracking Gantt Chart
A Tracking Gantt diagram in Microsoft Project is a specialized type of Gantt chart that allows project managers to compare the planned schedule with the actual progress of the project.
This view is essential for monitoring project performance and identifying any deviations from the original plan.
Some benefits of using Trcking Gantt Chart are:
- Comparison of Baseline and Actual Progress: The Tracking Gantt chart displays both the baseline schedule (planned) and the actual progress of tasks. This helps in identifying any variances between the planned and actual timelines.
- Visual Representation: Tasks are represented as bars on a timeline, with the baseline schedule shown in one color and the actual progress in another. This visual distinction makes it easy to see where the project is on track and where it is lagging.
- Resource Management: The Tracking Gantt chart can also help in managing resources by showing which tasks are behind schedule and may need additional resources to get back on track.
Levelling Gantt
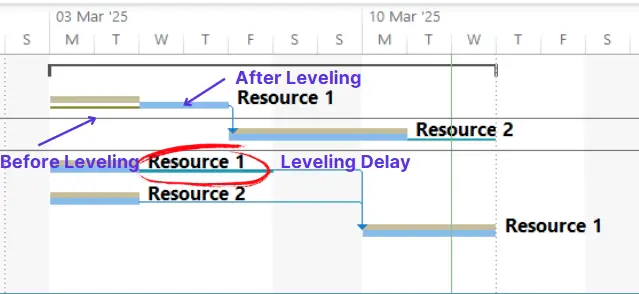
A Leveling Gantt diagram in Microsoft Project is a specialized Gantt chart used to visualize the effects of resource leveling on a project schedule. Resource leveling is the process of resolving resource over-allocations by adjusting task start and finish dates.
Leveling Delay helps to visualize how many days a task can be delayed to resolve the resource overallocation.
Some benefits of using Leveling Gantt Chart are:
- Flexibility: You can manually adjust leveling settings (e.g., leveling delay) to resolve the resource conflicts.
- Before and After Comparison: It shows the original schedule (shown as gold bar) alongside the leveled schedule (shown as blue bar), allowing project managers to compare the two and see the impact of resource leveling.
- Leveling Delay: The chart helps identify and resolve resource conflicts by adding leveling delay (float) to task dates to ensure that resources are not over-allocated.
Relationship Diagram
A relationship diagram in Microsoft Project is a visual tool used to illustrate the dependencies and logical relationships between tasks within a project. This diagram helps project managers understand how tasks are interconnected
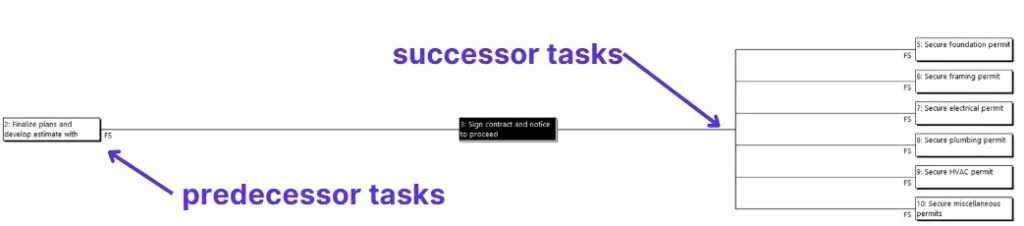
The relationship diagram displays tasks as nodes (boxes) and the dependencies between them as lines (arrows) connecting these nodes.
By highlighting task dependencies, the relationship diagram helps in identifying potential bottlenecks and areas of risk within the project schedule.
Timeline View
The Timeline View in Microsoft Project is a feature that provides a high-level visual representation of key dates and milestones within a project.

This view is designed to give project managers and stakeholders a quick and clear overview of the project’s schedule, making it easier to communicate important information and track progress.
Some benefits of Timeline View are:
- High-Level Overview: The Timeline View offers a concise visual summary of the project’s key dates and milestones, allowing for quick reference and understanding.
- Zoom Functionality: Users can zoom in and out to hide or reveal details, providing flexibility in how much information is displayed at any given time.
- Copy to Other Applications: The timeline can be copied to other Microsoft Office applications, such as PowerPoint, for presentations, or Word for documentation purposes.
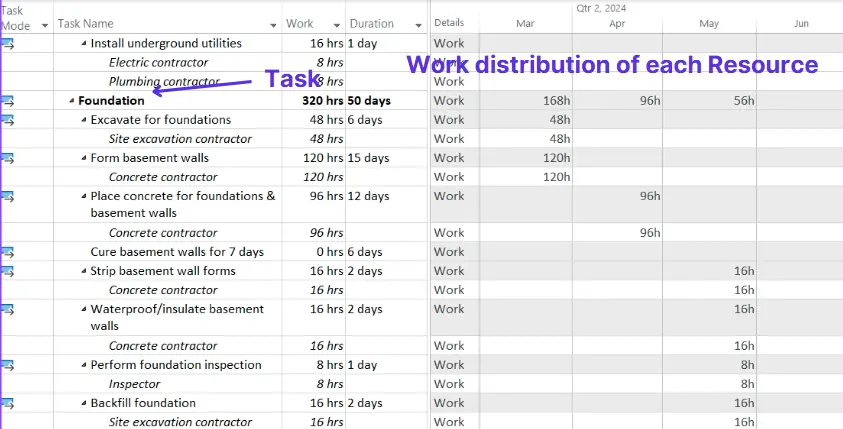
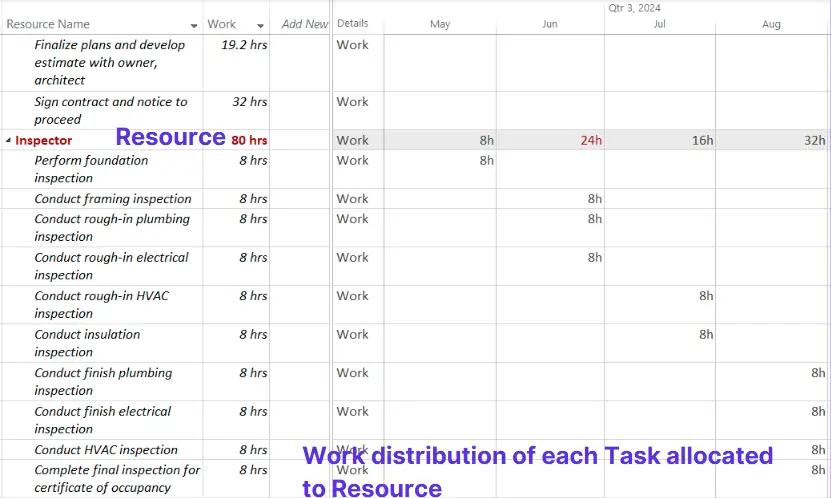
Task Usage
The Task Usage view displays tasks along with their assigned resources, showing how much work each resource is scheduled to perform on each task.
It provides a breakdown of the work distribution for each resource on a daily, weekly, or other time-phased basis, helping to identify periods of over-allocation or under-utilization.
Resource Usage View
The Resource Usage view displays resources along with the tasks they are assigned to, showing a work breakdown of each resource on daily,weekly or other time-phased manner.
The view helps in managing resource allocation by showing which tasks are assigned to which resources and the amount of work assigned to each resource.
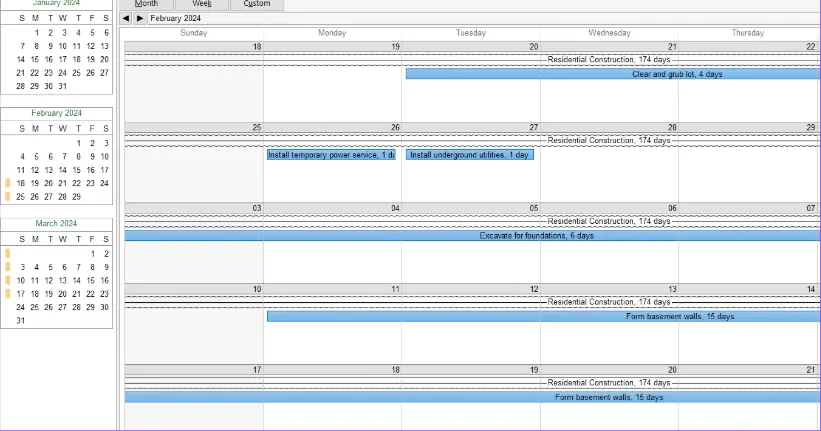
Calendar View
The Calendar View in Microsoft Project is a visual representation of the project schedule in a traditional calendar format. This view is particularly useful for project managers and team members who prefer to see tasks and milestones laid out in a familiar monthly or weekly calendar format.
Team Planner
The Team Planner View in Microsoft Project is designed to help project managers allocate and manage resources effectively.
Users can drag and drop tasks to different resources or time slots directly within the Team Planner, making it a dynamic and flexible tool for managing resources.
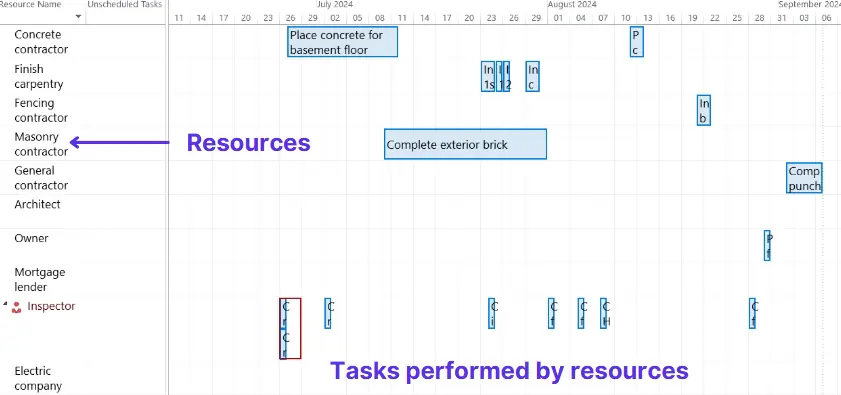
Tasks are shown as bars or blocks on the timeline, with their start and finish dates clearly indicated. This helps in quickly identifying when tasks are scheduled to occur for a specific resource.
Summary
Project timelines can be visualized using various methods beyond the traditional Gantt chart, including Network Diagram, Resource Usage View and Timeline View.
These alternatives offer different perspectives on project progress, task dependencies, and workload, catering to various project management needs. Each of these alternatives has its strengths, so you can choose the one that best fits your project’s needs. Do you have a specific project in mind that you’re working on?
Do you want to Master the World’s Most Popular Project Management Tool?
Check out my 18 Hours LIVE Online Course on Microsoft Projects.
Did you know that nearly 60% of Project Management roles posted on LinkedIn require Microsoft Projects skills?
Microsoft Projects, a project management software in use since 1984, stands out as the most established and widely utilized tool across various industries.
Major players like Fortune 500 companies rely on this software to propel their projects forward. Stay ahead of the curve. Acquire this valuable skill now and set yourself apart from other project managers.
For additional information:
Visit the course web-page:pmfornonpm.in/new-courses/


